Do these scatter plots reveal fraudulent vote-switching in Michigan? Yes
Maybe. This gentleman:
has attempted to disprove the argument presented by this gentleman:
but he failed. Here is why.
He begins:
... they show several plots including this one, which is supposed to show some evidence of election fraud happening in the 2020 US election in the state of Michigan. ... The idea is this plot should be straight, instead you've got this down slope. And that is meant represent a net shift of votes that should have been for Donald Trump over to Biden. However if you plot exactly the same date from the same precinct from the same county for Biden (which I did,) you'd expect to see those votes showing up, there should be an anomaly going the other way. You do that plot: it looks exactly the same. This cannot represent a net movement of votes because both plots are the same.

There is probably some misunderstanding here. The plots appear the same but **they do show an anomaly going the other way**. The plots could still represent an algorithmic shift of votes. The graphs **do not show** net votes, they show deviation. Seeing a linear deviation indicates an algorithmic bias towards Biden.
In people speak:
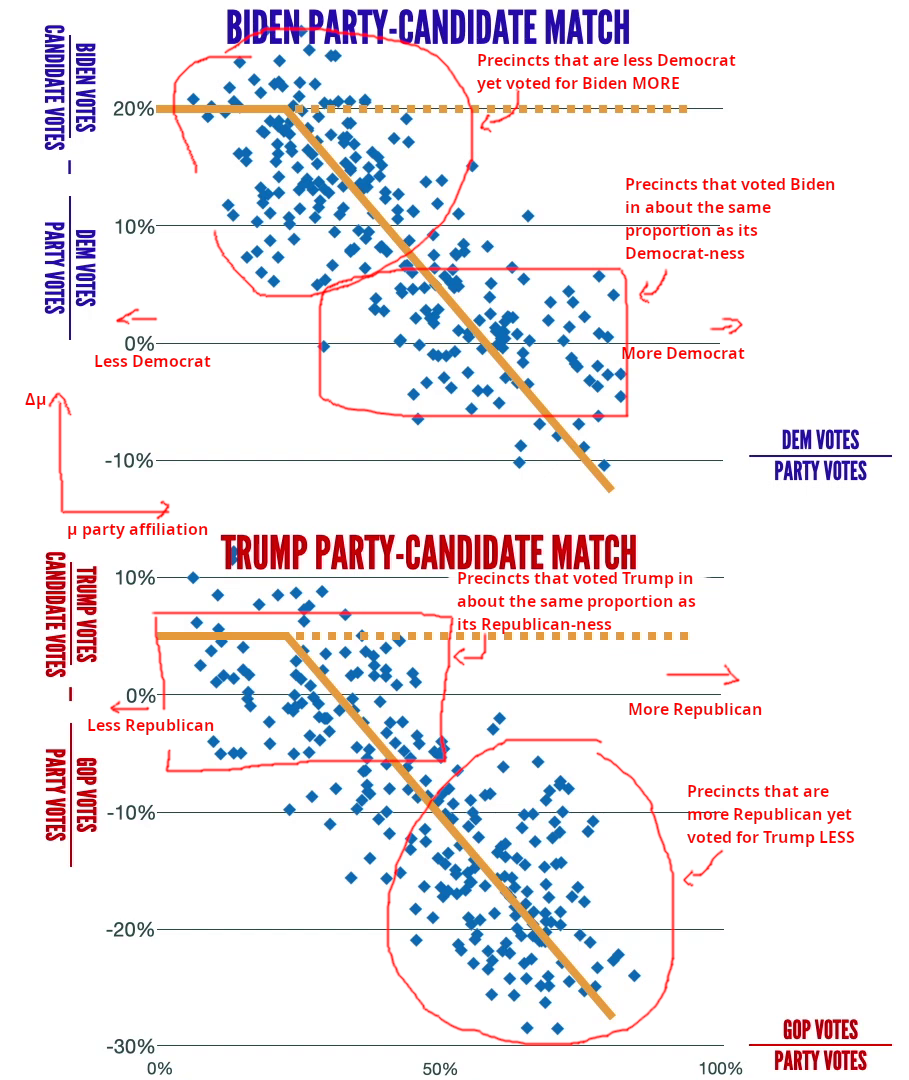
The x-axis is a precincts affiliation to a party and the y-axis is
how much more/less it voted relatively for the respective candidate.
- Left on the plot means LESS Democrat or Republican.
- Right on the plot means More Democrat or Republican.
- Up means a precinct vote MORE for a candidate than the precincts political affiliation.
- Down means a precinct vote LESS for a candidate than the precincts political affiliation.
- For the Democrat plot, a data point near the x-axis represents a precinct that voted for Biden in roughly the same proportion as it's Democrat-ness.
- And likewise for the Republican plot, a data point near the x-axis represents a precinct that voted for Trump in roughly the same proportion as it's Republican-ness.
In math/statistics speak: For a precinct, use the straight party vote as the mean (μ) political affiliation. By subtracting the presidential vote from the SPV, we get a change in mean.
Imagine some function f(x) that correctly guesses if a voter is going to vote for Biden.
note: Not sure why the text is wonky\begin{align} f({Biden}) = 1 \\ f({not Biden}) = 0 \end{align} To find the mean for a precinct sum the votes, divide by number of votes. $$ \mu = \frac{1}{n} \sum_{i=1}^n f(x) $$ Apply this for a sample population using the straight party votes (SPV): $$ \mu_1 = \text{Mean Democrat vote} = {\text{Democrat SPV} \over \text{Democrat SPV + Republican SPV}} $$ Next we will calculate the mean again using the remaining voter population (the ones that selected Biden/Trump manually.) $$ \mu_2 = \text{Mean Biden vote} = {\text{Biden votes} \over \text{Biden Votes + Trump Votes}} $$ To compare, plot the change in mean versus the SPV mean: \begin{align} \Delta\mu = \mu_1 - \mu_2\\ (\mu{_1}, \Delta\mu) \end{align}